Illustration by Jon Krause
STANDARDIZED TESTS may not tell us everything there is to know about a school like Mission High, but that doesn’t mean they don’t have their uses. And one of those uses is myth busting—in particular, the myth that America’s schools are in a state of terminal decline and students aren’t learning as much as those of a generation ago.
The real story is more complicated, and the best place to see it is the federal government’s National Assessment of Educational Progress, otherwise known as the Nation’s Report Card, the “gold standard,” or just plain NAEP. It provides a long-term set of results going back to the early 1970s, and unlike state tests, which vary substantially and are sometimes dumbed down to produce higher scores, the NAEP is widely trusted in the educational community. It can’t tell us anything about particular students or schools (since only a fraction of the nation’s schools participate), but it can give us a pretty good idea of how national averages have changed over time. So let’s take a look at the trend lines.
Myth No. 1: Kids today don’t know as much as they used to.
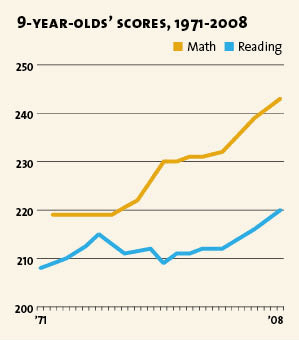
The chart below shows overall reading and math scores for 9-year-olds starting in the early ’70s. Since then, reading scores have gone up 12 points and math scores have gone up 24 points. Ten points on the NAEP roughly equals one grade level, which means that today’s 9-year-olds are performing more than a full grade level better in reading and two grade levels better in math compared to the ’70s.
Myth No. 2: But we haven’t made much progress with black and Latino kids.
In fact, scores for blacks and Latinos are up more than scores for whites. In reading, as the chart above shows, white kids’ scores are up 14 points, while Latinos’ have risen 24 points and blacks’ 34 points. In math, scores for white kids are up 25 points, while Latinos’ have jumped 32 points and blacks’ 34 points. There’s still a significant gap between whites and other groups, but we’ve been making steady—and largely unheralded—progress for the past 40 years.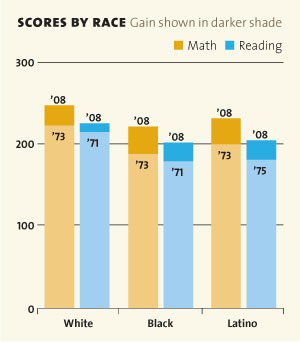
Myth No. 3: Private schools are doing okay, but public schools are still a mess.
Not really. Private schools have done well, with reading scores up 10 points and math scores up 22 points, but public schools have also improved in reading (4 points) and math (25 points). Overall, the rise in test scores is due to improvements at both private and public schools.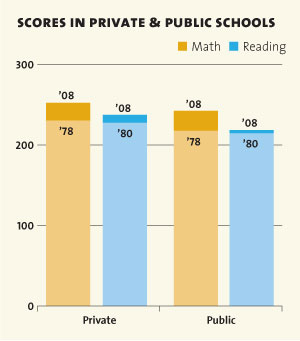
Myth No. 4: Well, but there’s still a big gender gap.
Not really. In reading, the gender gap is down from 13 points to 7 (still in favor of girls), and in math it’s been essentially zero for the entire life of the test.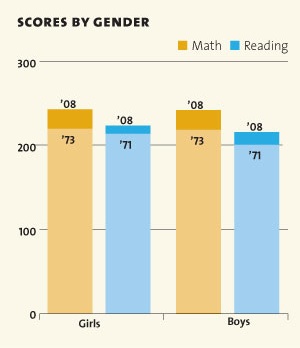
Myth No. 5: Fine. But the kids who really struggle have lagged way behind.
Wrong. Rising test scores aren’t restricted to our brightest kids with their helicopter parents. The NAEP reports scores by percentile, and the very brightest 10 percent of students have gained 20 points in math and 5 points in reading. Not bad. But the lowest decile—the toughest educational challenge our schools face—has improved even faster, a full 27 points (nearly three grade levels) in math and 19 points (two grade levels) in reading.
And there’s another thing worth noting here: Not only are all these gains consistent across race, gender, performance level, and type of school, they’ve also been pretty steady over time. You can’t attribute these achievements to No Child Left Behind (passed in 2001) or to any other single change.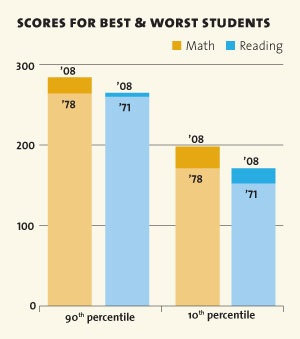
Myth No. 6: Great, everything’s fine then.
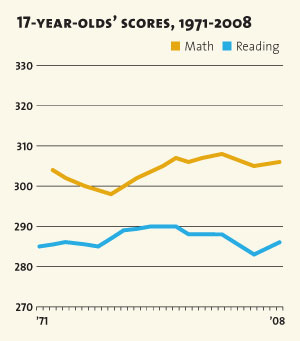
Not so fast. Unfortunately, these successes wash out almost completely by high school. The NAEP has data for kids at ages 9, 13, and 17, and the 17-year-olds’ scores show virtually no improvement in the past few decades. No one knows for sure why this is, but the raw data is clear: Reading scores are up only one point and math scores are up only two. And when you break it down, the results are just as lackluster. In reading, low scorers are up two points. Blacks’ scores increased sharply during the ’80s but have actually declined eight points since then. Latinos’ scores show the same pattern, peaking and then declining six points. And the gender gap is 11 points, with girls more than a full grade level ahead.
The picture in math is only slightly brighter. Low scorers improved 13 points through 1992, but have plateaued since then. The story is roughly the same for black and Latino scores, which rose during the ’80s but have been essentially flat since then.
There are a lot of stories you can tell with this data depending on how you cherry-pick it. But the one thing you cannot say, unless you torture the numbers beyond recognition, is that kids today are more poorly educated than kids of the past two generations. Contrary to the tired annual horror stories about how Johnny can’t read, the truth is that at worst, our kids don’t know any less than we do, and at best they may know quite a bit more.