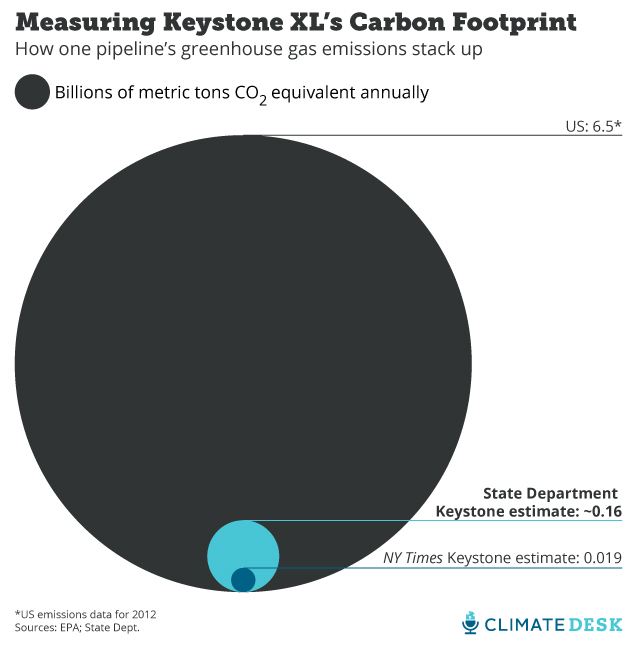
The New York Times had an interesting story earlier this week that aimed to put the carbon footprint of the Keystone XL pipeline, widely derided by environmentalists as the coup de grâce for climate change, in a broader context. The main takeaway was that even if the pipeline gets built, the carbon emissions from the oil it will carry will be such a small slice of the global pie as to be practically negligible; one analyst quoted in the story dismisses Keystone’s carbon footprint as a “rounding error.”
The story is right about a couple things: For the Obama administration to take a strong stance on climate change, finalizing and enforcing tough new limits on emissions from cars and coal-fired power plants will likely have a much bigger impact than blocking this one pipeline (a final decision on the pipeline was delayed once again by the State Department last Friday). And in any case, according to the State Department’s latest environmental assessment, most of the Canadian oil that the pipe would carry is going to get dug up and burned one way or another, so blocking the pipeline won’t necessarily be a win for the climate.
It shouldn’t surprise anyone that, as the chart above shows, the footprint of this one infrastructure project is much less than that of the entire US economy. But that doesn’t mean we should write off all that oil’s carbon footprint altogether. In fact, the Times story’s own such chart dramatically understates what that footprint will really be, using a statistic out of context that’s an order of magnitude lower than the latest official estimate.
The Times writes that the pipeline will be responsible for an annual 18.7 million metric tons of emissions, citing a 2013 letter from a top EPA administrator to senior State Department officials offering feedback on their environmental review of the pipeline. But in the letter, that figure isn’t presented as an estimate of the pipeline’s total footprint. Instead, it’s an estimate of how much greater the emissions will be as a result of the pipeline carrying oil sands crude, the exceptionally carbon-heavy oil that will run in the pipe, as opposed to an equivalent volume of conventional crude oil.
In other words, 18.7 million metric tons is only the difference between conventional and oil sands oil, the extra carbon boost that comes from using a dirtier fossil fuel, what the EPA letter calls “incremental emissions.”
The real number to look at is from the State Department’s final environmental analysis (last paragraph on page ES-15) released in January, and it’s much higher. According to that report, over its full lifecycle (from production to refinement to burning) the oil carried by the pipeline will emit 147-168 million metric tons of carbon dioxide equivalent emissions annually—more than the whole nation of Pakistan, according to Energy Information Administration statistics, and about as much as 41 coal-fired power plants.
The Times analysis is also problematic because it makes an erroneous apples-to-oranges comparison between country-level emissions data from the Energy Information Administration that counts only carbon dioxide, and Keystone emissions estimates that are given in terms of “carbon dioxide equivalent” and thus count other greenhouse gases like methane (although CO2 still accounts for the lion’s share). For a better apples-to-apples comparison, I only included the US in my chart (and not the other nations included in the Times chart), because an official estimate of carbon dioxide equivalent emissions is only available for that country.
Although even the State Department Keystone estimate is a small-ish chunk of total US emissions, it’s certainly nothing to sneeze at, especially when President Obama has repeatedly linked approval of the pipeline to a finding that it won’t have a major impact on climate change.


