
Get your news from a source that’s not owned and controlled by oligarchs. Sign up for the free Mother Jones Daily.
This NOAA map shows a sampling of places where weather records were broken last year. You probably guessed that red indicates heat. Yellow represents dryness; orange is a double whammy record for heat and dryness.
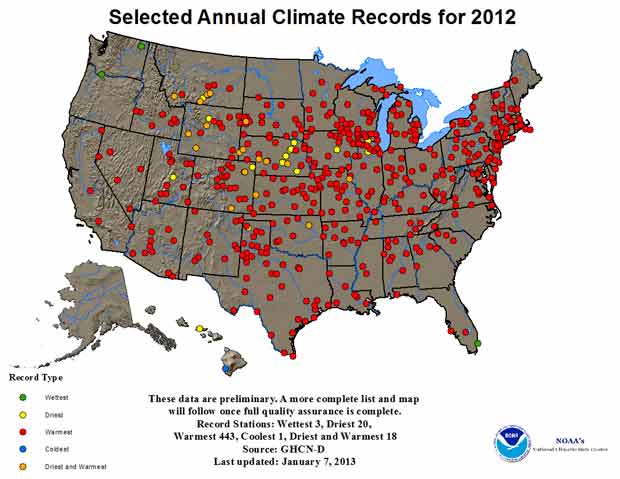
Image courtesy of NOAA