The National Oceanic and Atmospheric Administration just updated its Climate Normals for the United States. Per agreement of the World Meteorological Organization, “normals” are calculated per decade, rather than per year. NOAA’s latest update is crunched from weather data compiled from 1981 to 2010.
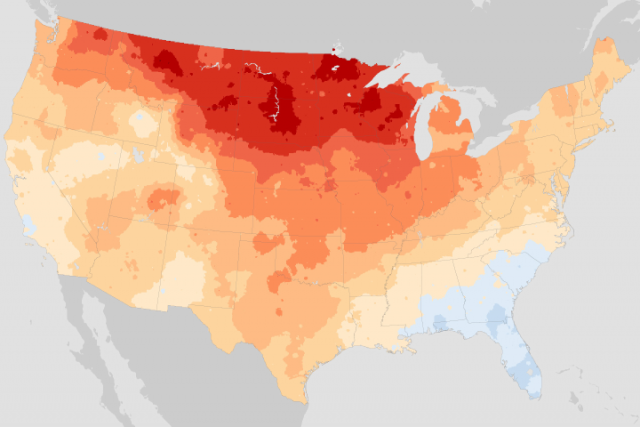
The new annual normal temperatures for the US strongly reflect a warming world.  July Maximums, 1981–2010 compared to 1971–2000.
![]() January Minimums, 1981–2010 compared to 1971–2000. Credit: NOAA.
January Minimums, 1981–2010 compared to 1971–2000. Credit: NOAA.
In the two images above you can see the differences between the old normals (1971 to 2000) and the new normals. The top image shows changes in July maximum temperatures. The bottom shows changes in January minimum temperatures. Warmer temperature changes are orange and red. Cooler temperature changes are blue.
A few notables:
- On average, the contiguous US experienced the lowest temperatures on January nights and the highest temperatures on July days.
- Both January minimum temps and July maximum temps changed in the past three decades—though not equally.
- Parts of the Great Plains, the Mississippi Valley, and the Northeast experienced slightly cooler July maximums from 1981–2010 compared to 1971–2000 (top map).
- Far more striking are the January minimums (bottom map). Nighttime January temps were higher everywhere except the Southeast. Warmer nights were most pronounced in the northern plains and northern Rocky Mountains.
- In some places the new normal were several degrees warmer than the old normal.
 and maximum (right) temperatures across the United States are warmer in the 1981-2010 Climate Normals than in the 1971-2000 version. Credit: NOAA.") On a state-by-state basis, the annual average minimum (left) and maximum (right) temperatures across the United States are warmer in the 1981-2010 Climate Normals than in the 1971-2000 version. Credit: NOAA.
On a state-by-state basis, the annual average minimum (left) and maximum (right) temperatures across the United States are warmer in the 1981-2010 Climate Normals than in the 1971-2000 version. Credit: NOAA.
As you can see in the maps above, based on average year-round temperatures, every state experienced warmer temperatures in 1981–2010 compared to 1971–2000.
A few pros and cons of a warming US:
- Fire season is now longer due to warmer nights.
- Pollination patterns are changing, with flowering plants blooming an average of one day earlier each decade.
- Warmer nights and later onset of freezing days also means plants are shifting farther north.
- Warmer temperatures pose hazards to plants by enabling pests (pine bark beetle and wooly adelgid) to thrive in places where cold winters previously froze them.
 Standing dead trees from pine beetle damage, seen in a patch of forest in the Rocky Mountains. Warmer winters are allowing the destructive insects to thrive, infesting 1.5 million acres of lodgepole pine in Colorado. Credit: NOAA.
 Eastern hemlocks killed by an infestation of woolly adelgids. Credit: William M. Ciesla, via NOAA.