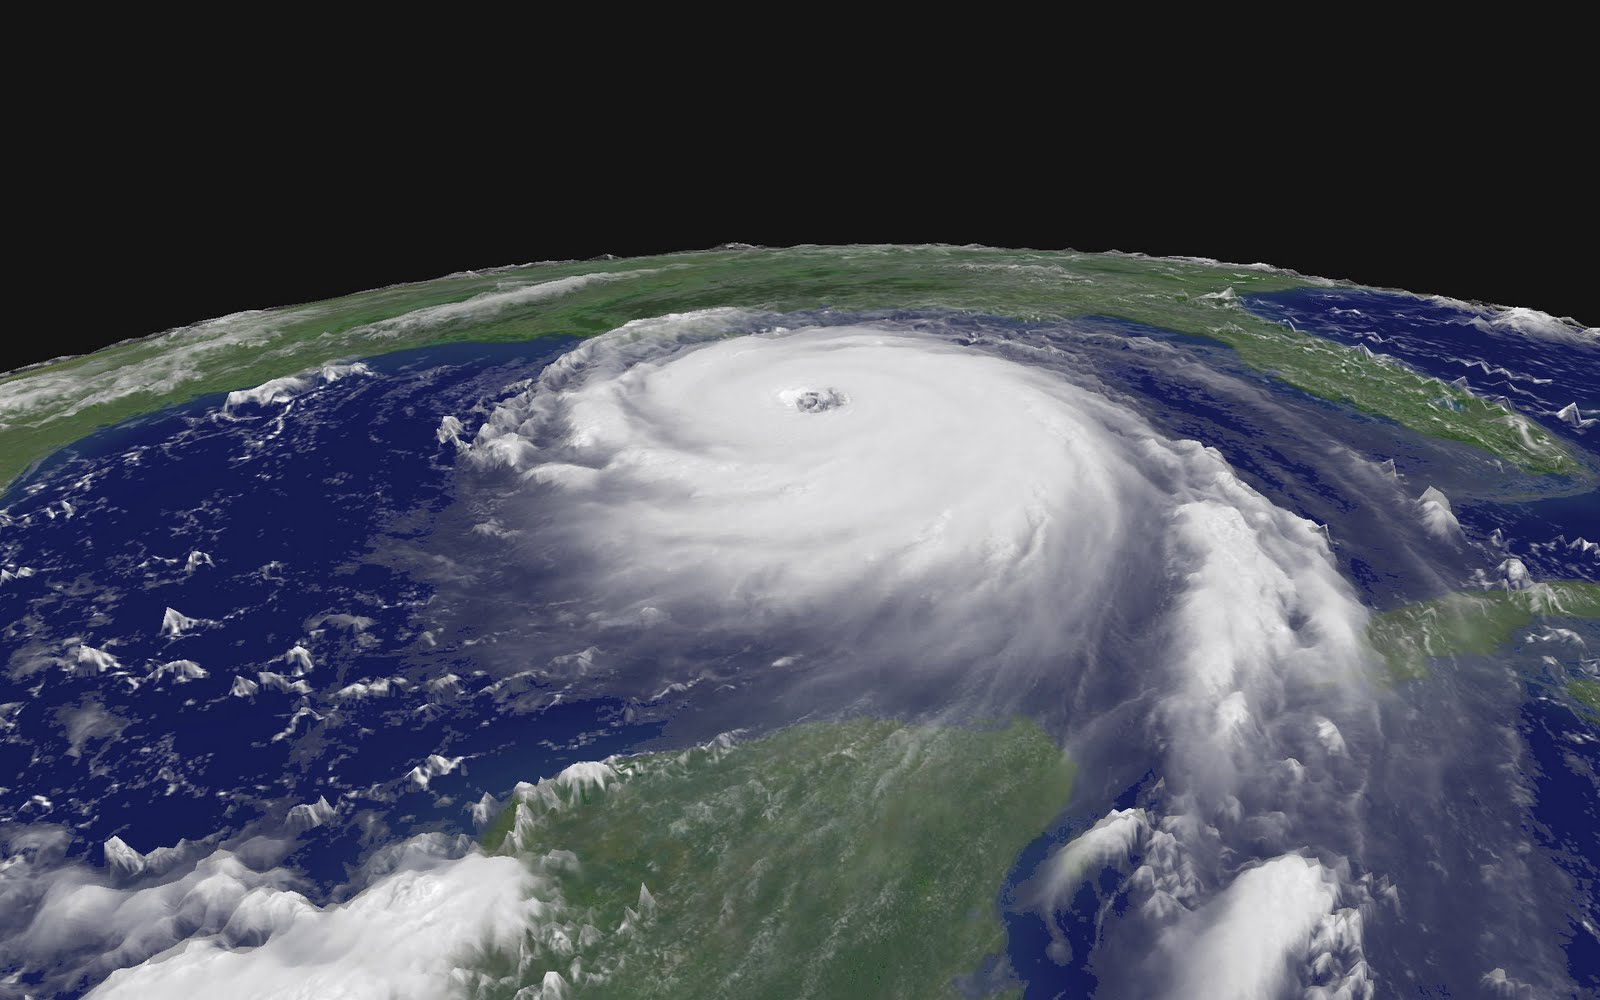
Credit: NOAA.
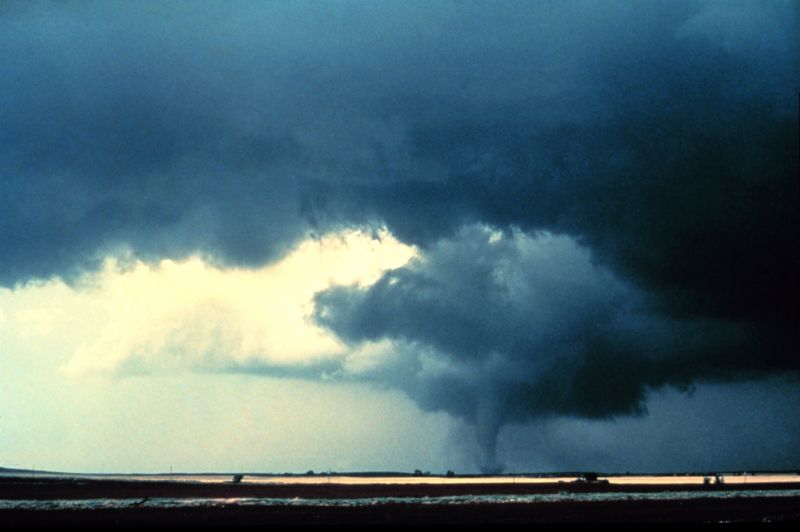
It’s here. The start of the 2011 hurricane season. And so is the seasonal hurricane forecast of Phil Klotzbach and Bill Gray at Colorado State University. Their summary:
We continue to foresee well above-average activity for the 2011 Atlantic hurricane season. We are predicting the same levels of activity that were forecast in early April due to the combination of expected neutral ENSO conditions and very favorable atmospheric and oceanic conditions in the tropical Atlantic. We continue to anticipate an above-average probability of United States and Caribbean major hurricane landfall.
-
16 named storms
-
9 hurricanes
-
5 intense hurricanes
Compare that to the average during the 50 years between 1950 and 2000:
-
10 named storms
-
6 hurricanes
-
2 intense hurricanes

Sea surface heights captured by the OSTM/Jason-2 satellite. Credit: NASA/JPL.
The four reasons for Klotzbach’s and Gray’s above-average forecast:
1. The likelihood of neutral to weak La Niña conditions between August and October, the most active portion of the hurricane season.
One way we track La Niña’s characteristic water temperatures is by tracking sea surface heights, which are used to calculate how much heat is stored in the ocean below.
A weak or neutral La Niña generally results in average to below average levels of vertical wind shear. Weaker winds allow hurricanes to grow.

Tropical Cyclone Heat Potential on 31 May 2011. Credit: NOAA.
2. Above average May sea surface temperatures in the tropical Atlantic.
As you can see in the image above, sea surface temperatures are already at or above the tropical storm threshold of about 26 degrees Centigrade. As of 31 May, they were about 0.5 above normal in the Atlantic and 0.5 to 1.0 C above normal in the Gulf of Mexico.
That’s kindling to a hurricane’s fire.

Atmospheric pressures at sea level. Anomalies recorded across the Atlantic in May 2011. Credit: NOAA.
3. Below average atmospheric sea level pressures during May in the tropical Atlantic.
You can see the extent of anomalously low sea level pressures throughout most of the tropical and subtropical Atlantic in the image above.
Lower pressures are gas to a hurricane’s fire.

Simplified view of the oceanic thermohaline circulation, also known as the ocean conveyor belt. Credit: NOAA.
4. The current phase of the Atlantic Multi-Decadal Oscillation, which began in 1995, is conducive to bigger and more frequent hurricanes. The forecasters explain it thus:
Atlantic Multi-Decadal Oscillation (AMO)—A mode of natural variability that occurs in the North Atlantic Ocean and evidencing itself in fluctuations in both sea surface temperature and sea level pressure fields. The AMO is likely related to fluctuations in the strength of the oceanic thermohaline circulation. Although several definitions of the AMO are currently used in the literature, we define the AMO based on North Atlantic sea surface temperatures from 50-60°N, 10-50°W.

Hurricane Alley. Image courtesy NASA GSFC.
It mostly all starts in Hurricane Alley (above), when storms fueled by hot air over the Sahara Desert meet cooler air over the Gulf of Guinea and roll off Africa into the Atlantic.
Some of these waves, which begin with a simple thunderstorm—not that a thunderstorm is ever simple—will provide the sparks of energy and spin needed to grow a hurricane a few miles down the line in the waters of the Atlantic or the Caribbean or the Gulf of Mexico.

Credit: NOAA.
Here are the known travel paths of all 1,325 tropical cyclones born between 1851 and 2004.
The Klotzbach and Gray forecast calls for a much-higher-than-average chance of a major hurricane hitting the US this year:
-
A 48-percent chance along the East Coast, when 31 percent is average
-
A 47 percent chance along the Gulf Coast, when 30 percent is average
-
A 61 percent chance in the Caribbean, when 42 percent is average
The video shows 2010’s only June hurricane, Alex, and its two-week long birth and death, as it fought its way across the Atlantic, getting torn apart and rebuilding, finally forming as a hurricane in the Gulf of Mexico.
The cyclic passing of gauzy white layers across the screen from right to left marks the transition from day to night, as the data from the visible spectrum of the daytime passes to the data from the infrared at night.
Crossposted from Deep Blue Home.