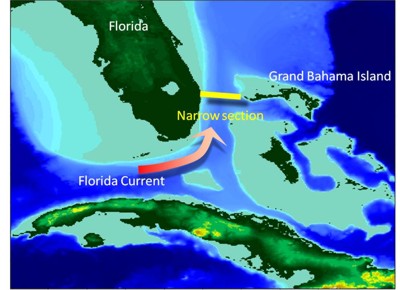
Topographical map with yellow bar showing the narrow section of the Straights of Florida that forms a bottleneck for the Florida Current. Image credit: IPRC/SOEST/UHM
The video (below) shows computer simulations of one possible scenario for the fate of the Gulf of Mexico’s oil catastrophe over the course of a year. In the model, 5 million buoyant particles are released continuously from April 20 to September 17 from the Deepwater Horizon rig. What’s really interesting is what you might call the Gulf Stream Whiplash Effect. The highlights, or rather lowlights of the findings:
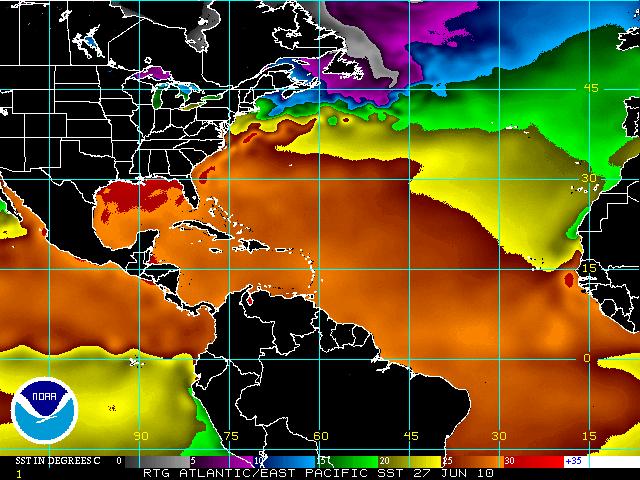
- Oil spreads initially in the Gulf of Mexico before entering the Loop Current, the narrow Florida Current, and finally the Gulf Stream.
- After a year, about 20 percent of the particles have been transported through the Straits of Florida and into the open Atlantic.
- Coastlines near the Carolinas, Georgia, and northern Florida might see the effects of the catastrophe by October.
- The main branch of the subtropical gyre will likely transport the oil towards Europe, though strongly diluted.
- As northeasterly winds intensify near Florida in October and November, the oil in the Atlantic moves closer to eastern US shores as it retreats from western Florida shores.
- The narrow deep Straits of Florida force the Florida Current into a narrow channel, creating a tight bottleneck for the spreading of oil into the Atlantic. As the animation suggests, a filtering system in the narrowest spot of the Florida Current could mitigate the spreading of the oil film into the North Atlantic.
The explanantion behind the model:
The animation shows the calculated surface particle concentrations for grid boxes about 10-km-by-10-km in size into April 2011. For an estimated flow of oil from the Deepwater Horizon of 50,000 barrels per day over a 150 day period, a concentration of ~10 particles per grid box in the animation corresponds roughly to an oil volume of 2 cubic meters per 100 square kilometers.
The dispersal model doesn’t capture the real-world stuff that oil does, like coagulate, form tar balls, and get broken down over time by chemical and microbial degradation. Therefore surface concentrations relative to the actual spill may be overestimated. Or not. Seeing there might be more than 50,000 barrels a day being released. At any rate, the animation is designed not as a specific prediction but as a scenario to guide research and mitigation efforts.
The work was done by researchers from the School of Ocean and Earth Science and Technology at the University of Hawaii at Manoa.