NASA image courtesy the MODIS Rapid Response Team
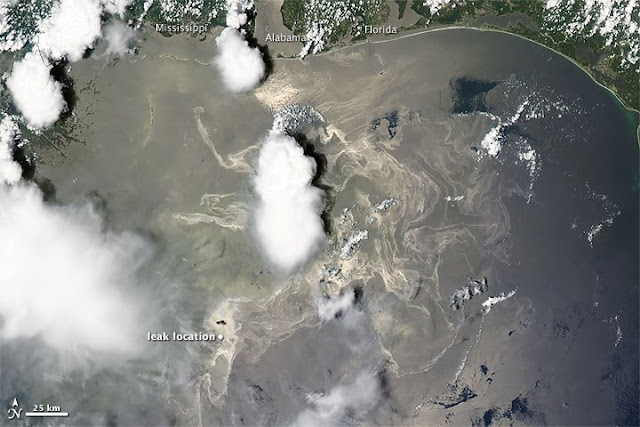
This image of the Gulf of Mexico was taken on 19 June, showing oil spreading northeast from the leaking Deepwater Horizon well and appearing as a maze of silvery ribbons in this photolike image from the MODIS on NASA’s Terra satellite. From the Earth Observatory caption:
The location of the leaking well is marked with a white dot. North of the well, a spot of black may be smoke; reports from the National Oceanic and Atmospheric Administration say that oil and gas continue to be captured and burned as part of the emergency response efforts. The large image provided above is at MODIS’ maximum spatial resolution (level of detail). Twice-daily images of the Gulf of Mexico are available from the MODIS Rapid Response Team in additional resolutions and formats, including a georeferenced version that can be used in Google Earth.
Another way to look at the spill can be found on the website IfItWasMyHome, which helps put the spill into perspective. You can overlay the current area of surface oil against your own county/state/country. The site’s been up and running for a while but the spill changes daily.
Just how radically the spill changes from day to day can be seen in this oil spill timeline map. You’ll have to go to the ESRI website to run the animation. It’s worth the click. Note that you can also click through to a larger advanced animation with multiple layers of information.


