
Do we really need to shut down restaurants? Or is this a countermeasure with low value at fighting COVID-19?Kevin Drum
Reader SL forwarded to me an interesting estimate of how well each state is doing controlling the spread of COVID-19. I’m a little reluctant to write about this since I can’t independently judge it, but it’s a weekend, so let’s go wild.
The author is Kevin Systrom and he uses Bayesian statistics to estimate the trend value of R0 which tells us how fast the virus is spreading. Any value above 1.0 means that each infected person infects more than one other person. In that case, the total number of infections rises exponentially. A value below 1.0 means each infected person infects less than one person. In that case, the total number of infections will decline. Obviously our goal is to put in place countermeasures that will get the value of R0 below 1.0 and keep it there.
I’ve long been sort of fascinated by Bayesian statistics, even though it seems like it mostly produces the same results as ordinary frequentist statistics. But that’s OK: it means that the procedure outlined in “Real Time Bayesian Estimation of the Epidemic Potential of Emerging Infectious Diseases”—which Systrom applies to COVID-19—is probably fairly conventional. The real problem isn’t with the statistical methodology, but with the fact that Systrom relies on confirmed case counts, which we know to be highly unreliable. On the other hand, the algorithm compares case counts day-to-day over a period of seven days, and it’s likely that any errors in the count stay about the same over such a short period. So there’s reason to think that this approach might produce something useful.
Without further ado, here are his results:
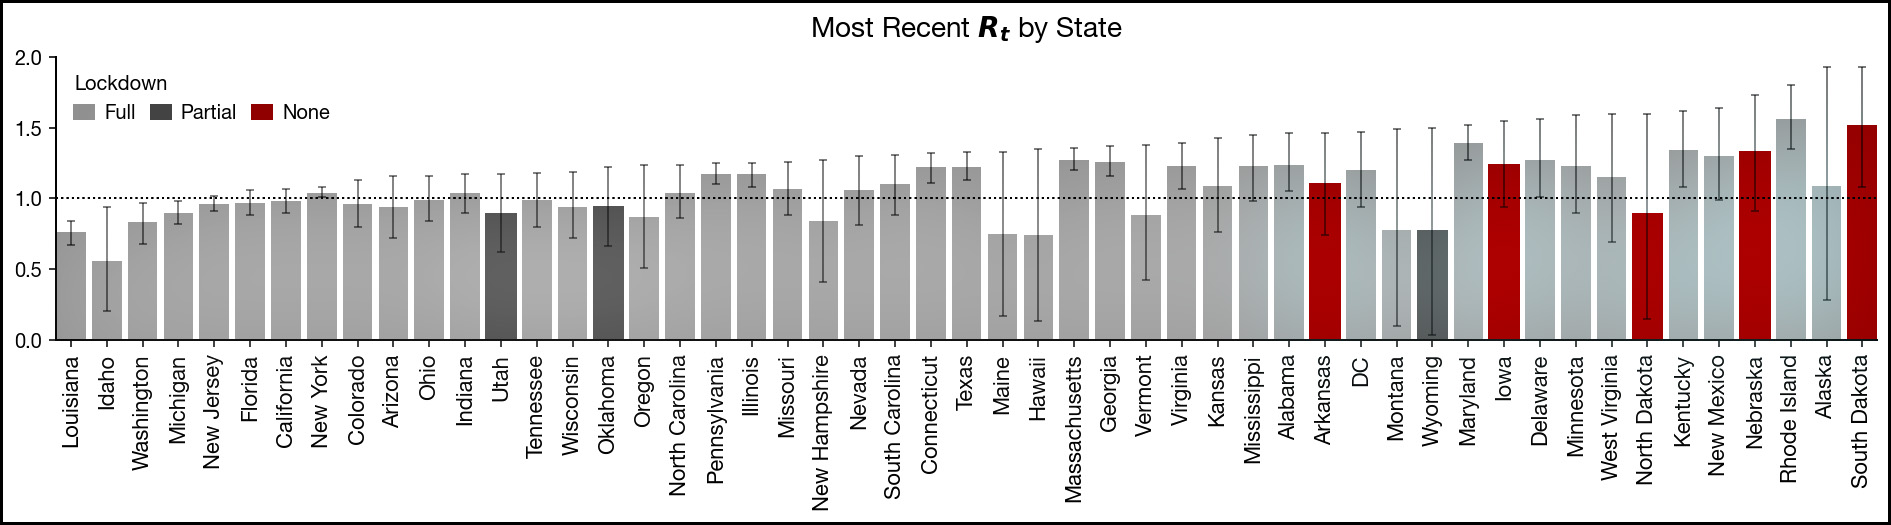
(Note that these results only go through April 11. It would be interesting indeed to see an updated chart.)
The bars show the point estimate for each state: Idaho is lowest at R0 = 0.55 and Rhode Island is highest at R0 = 1.55. However, the states are arranged by the high point of their error bars. The reason for this is that the size of the error bars varies widely, and unless the top of the error bar is below zero you can’t be sure that R0 is truly below 1.0. Systrom suggests that if the top of the error bar is below 1.1, it means a state most likely has the epidemic “under control.” There are eight states in this category:
- Louisiana
- Idaho
- Washington
- Michigan
- New Jersey
- Florida
- California
- New York
The states that are worst off are the ones where even the bottom of the error bar is above 1.0. There’s not a remote chance that they’re anywhere near getting things under control. There are 12 states in this category:
- Alabama
- Virginia
- Illinois
- Kentucky
- South Dakota
- Pennsylvania
- Connecticut
- Texas
- Georgia
- Massachusetts
- Maryland
- Rhode Island
Systrom adds this: “It’s clear that all non-lockdown states cluster on the right-hand side. While we cannot be sure the true Rt value is that high, this graph should give any policymaker in a non-lockdown state pause.” (The non-lockdown states are the red bars in the chart above.)
Systrom takes this as evidence in favor of lockdowns, but I have a different interpretation. Take California, which is the poster child for taking COVID-19 seriously. We locked down early and tight and Systrom puts our R0 at about 1.0. Meanwhile, South Dakota is the poster child for its governor’s refusal to even think about lockdowns and Systrom puts their R0 at 1.5.
Think about that. There are differences between states, of course, and that might account for part of what’s going on. Still, an enormous disparity in countermeasures produced a difference in R0 of only 1.0 vs. 1.5. That doesn’t seem like an awful lot. FWIW, I take it as yet another piece of data that we’re locking down without knowing which measures really work and which are window dressing. There’s just too much evidence accumulating that the value of (some) countermeasures is simply not as great as we’ve been assuming.