
Marc Edwards and his team at Virginia Tech have published a new paper that uses a clever way of calculating lead levels in the Flint water supply over the past five years. It turns out that sewage sludge is tested for metal content monthly, and it also turns out that the metal content of the sludge is closely correlated with the metal content of the system’s water supply. This makes it a fairly simple exercise to convert the lead content of the sludge into lead levels in the water. Here are the results:
Each dot represents four months, with the switch to Flint River water coming in April 2014.¹ The spike in water lead came very quickly after that, but lasted only a short time. By October 2014 lead contamination in drinking water was back to its normal, pre-switch level, and by mid-2016 had dropped below the EPA “action level” of 15 ppb. By the beginning of 2017, Flint water was probably cleaner than the majority of municipal water systems in the US.
There’s good news and bad news here. The bad news is that Flint’s baseline level of lead was around 20 ppb before the crisis, and this is too high. The good news is that Flint water spent only a few months at an extreme level before returning to its baseline, and then declined even further as filters were widely installed. This means that Flint children were exposed to extreme lead levels for only a short time and probably weren’t seriously affected, which in turn should reduce stress levels among Flint parents about how much the lead crisis affected their kids.
In addition to the basic results for Flint water, the new paper also has an interesting comparison with another lead crisis. Here’s the original chart from the paper:
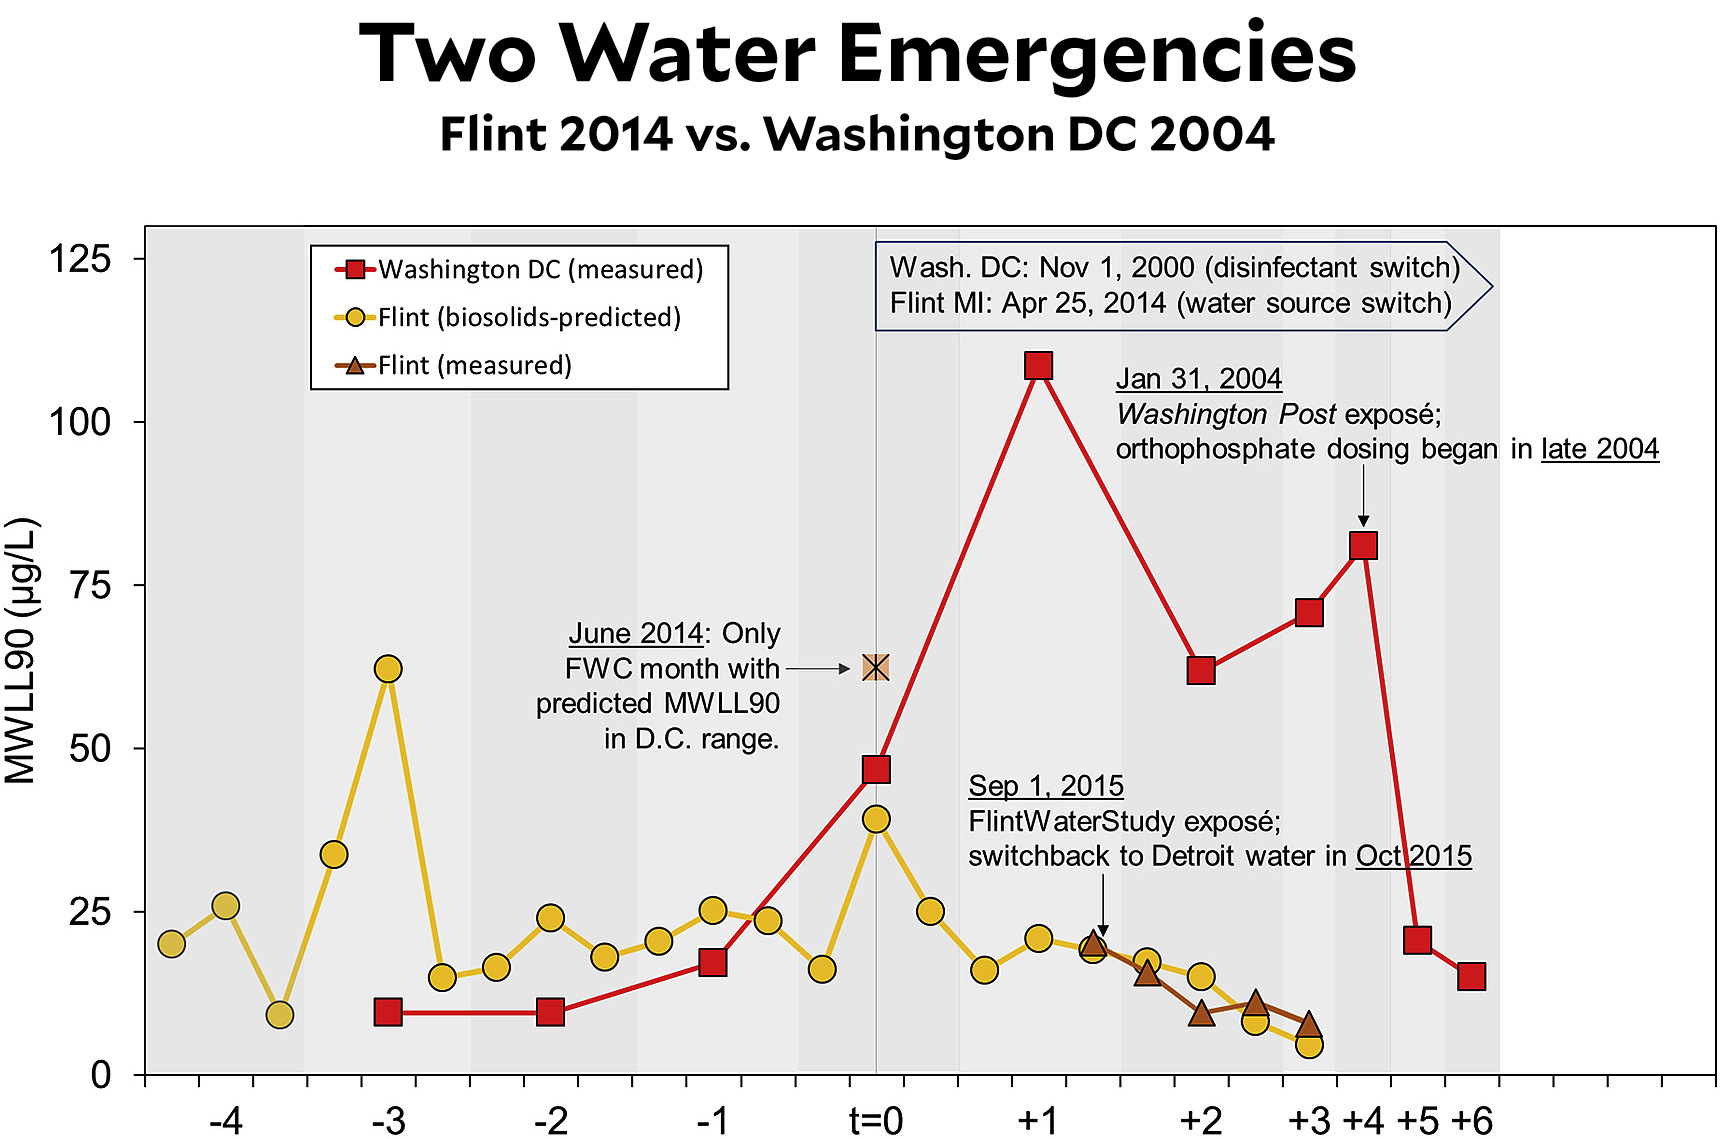
There are two interesting things here. First, Flint appears to have suffered a lead crisis in 2011 even worse than the one in 2014—but nobody knew about it. It was only the sludge testing that revealed it. Second, Washington DC suffered a much worse lead crisis 20 years ago: as the chart shows, starting in 2000 DC’s water supply was contaminated at far higher levels than Flint, and the contamination lasted for four full years. This is enough to cause serious developmental damage in a 3-4 year cohort of DC children. The sludge analysis is a powerful tool that finally allows us to see just how serious it was compared to Flint, and yet somehow Flint became a viral sensation while the DC lead crisis is largely forgotten. Go figure.
¹Technical note: The first dot represents the period December 2013-March 2014. The sludge calculation is designed to produce a lead level that represents the mean of first draw, second draw, and third draw water. The 90th percentile standard means that 90 percent of lead measurements fell below the value on the chart.