
As you all know, I’m smitten by all things lead related. A couple of days ago I came across an interesting little historical anecdote that I’m going to tell you now.
When I was writing my big lead-crime piece several years ago, one of the things I was curious about was why the EPA decided to phase out leaded gasoline starting in 1975. Unfortunately, there aren’t very many people around today who were personally involved in this stuff 40 years ago, and I ended up getting several conflicting answers that I couldn’t really reconcile. Since it wasn’t central to my story anyway, I gave up and skipped the whole thing.
Then, last week, reader David P. pointed me to a column by Barry Nussbaum, chief statistician at the EPA for over a decade and currently president of the American Statistical Association. As soon as I read it I called Nussbaum, who was a young EPA analyst in the late 70s when he—well, we’ll get to that. First, though, the answer to my question.
According to Nussbaum, EPA wanted places like California to reduce smog, and that meant cars would have to be fitted with catalytic converters. However, since gasoline lead ruins catalytic converters, refineries needed to produced unleaded gasoline. This was the initial impetus behind unleaded gasoline. The fact that it also reduced atmospheric lead was basically a happy accident.
Once that was done, however, EPA started looking more closely at the health effects of lead. It was no secret that high levels of lead poisoning were dangerous, but new research was showing that even moderate levels could be dangerous, especially in young children. So now EPA had two reasons to phase out leaded gasoline.
As it happens, they were doing this on two tracks. One track was unleaded gasoline. The other was a phasedown of the amount of lead in leaded gasoline: from 1.7 grams per gallon in 1975 to 1.2 in 1976, 0.9 in 1977, and 0.6 in 1978. But there was a problem with this: reducing the amount of lead also reduced the amount of gasoline you could refine from each barrel of crude oil. The difference wasn’t huge, but after the oil embargo of 1973 it was enough to raise policy questions. Thanks to all this, in 1979 Jimmy Carter was considering whether to halt the EPA phasedown of lead in gasoline.
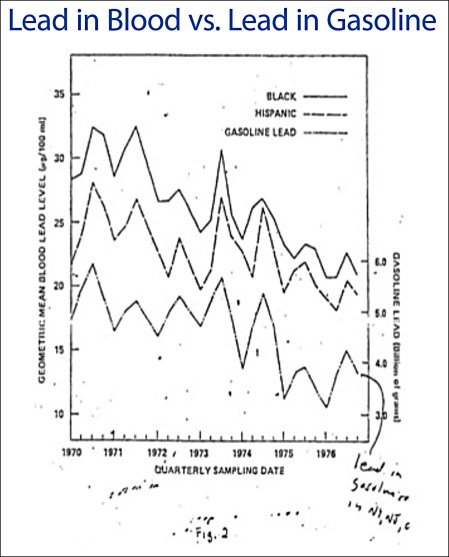
By coincidence, at the same time HUD was trying to get more funding for its program to remove lead paint from old housing stock. As part of this effort, EPA looked at the incidence of high blood lead levels in children, and Nussbaum produced the following chart:
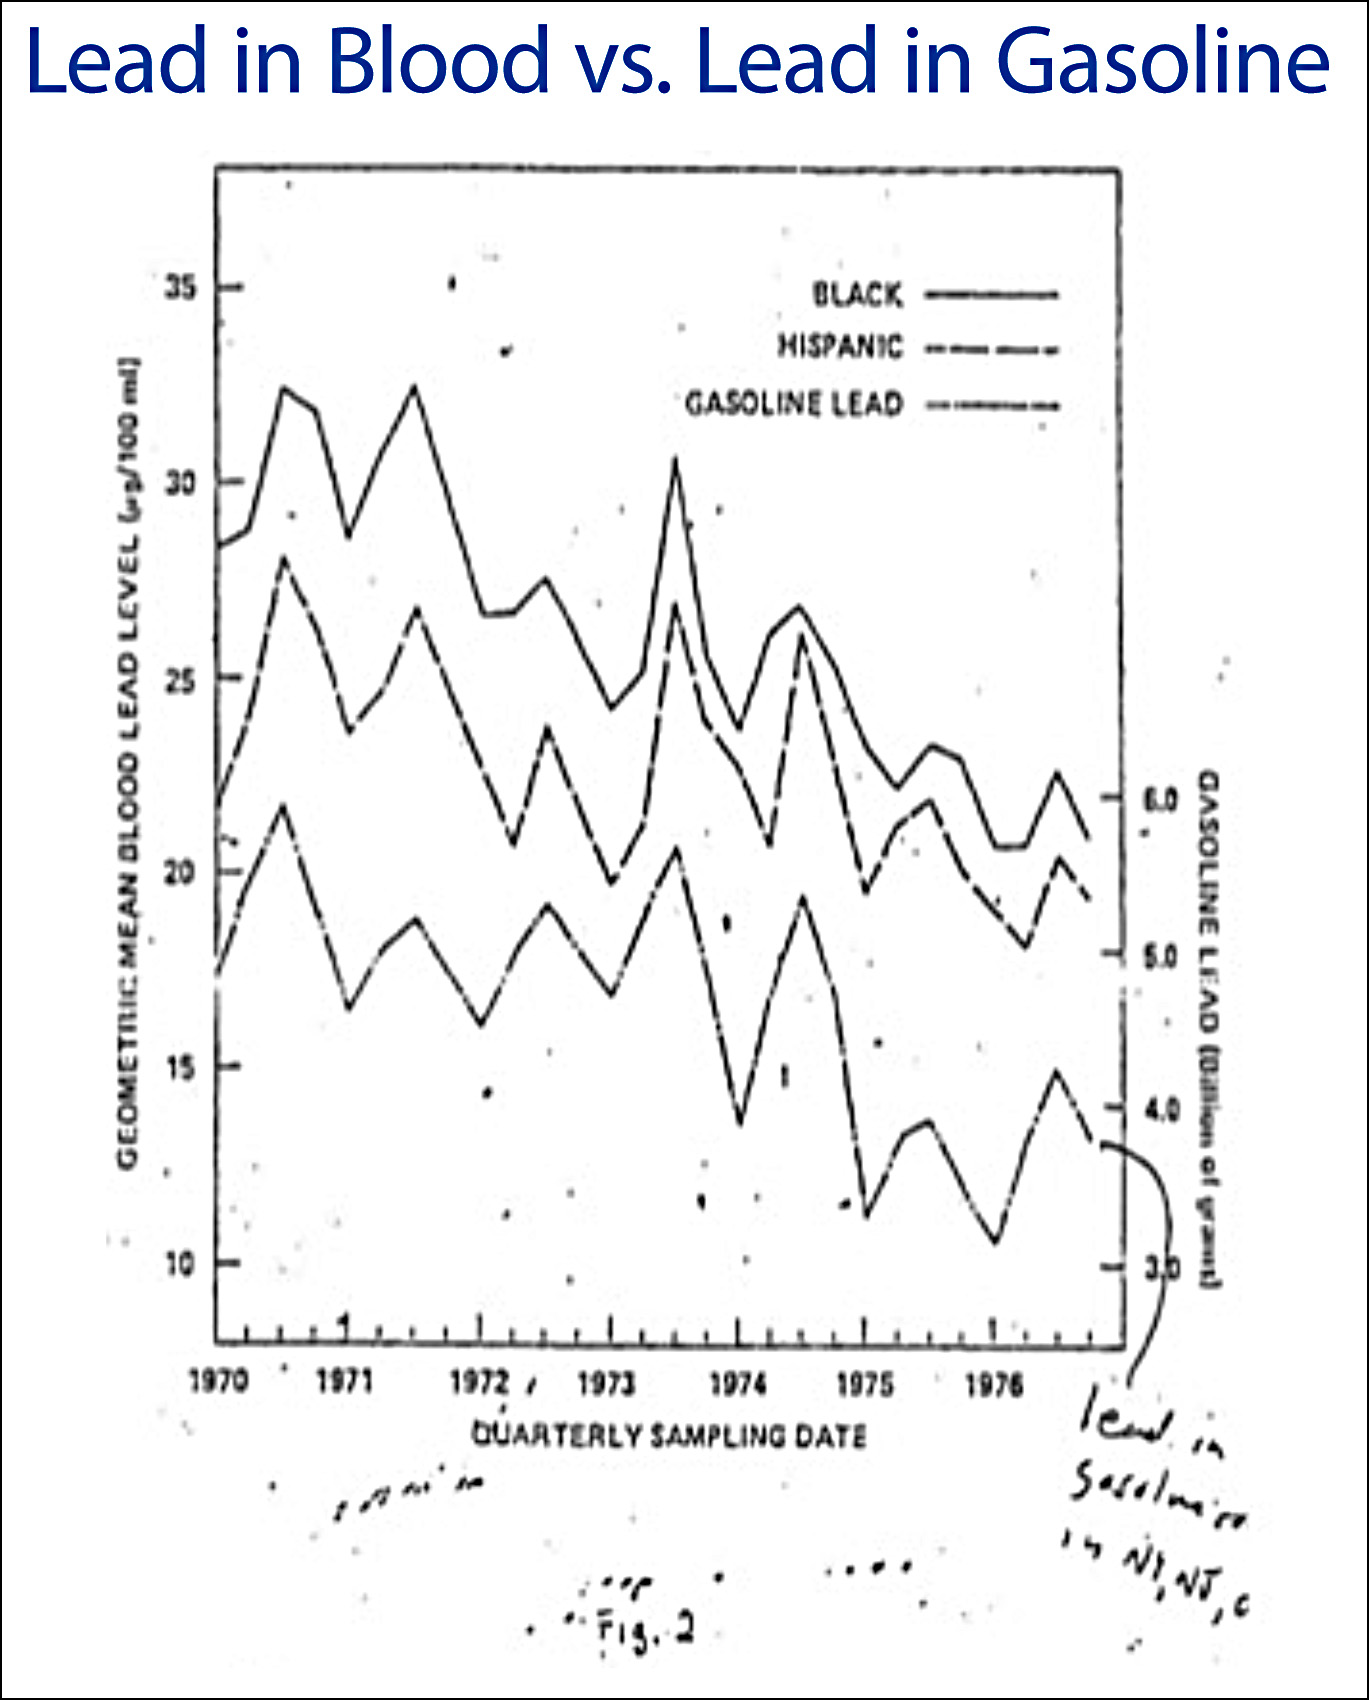
There are three things to notice about this chart:
- It shows that blood lead levels spike every year in the summer.
- It shows that lead levels in children appear to be correlated with gasoline lead emitted into the atmosphere.
- It shows that black and Hispanic children had really high levels of lead poisoning.¹
The first item—unfortunately for HUD—suggested that lead poisoning was not correlated with lead paint in housing. After all, there’s no reason to think that kids are exposed to more lead paint in the summer. The second item suggests that lead poisoning is correlated with gasoline lead.² And the third item immediately convinced Carter to continue the lead phasedown. “He stated he did not want any policy that might have a particularly deleterious effect on these two groups,” Nussbaum says.
On a statistical note, Nussbaum adds this: “With the benefit of hindsight, Carter was concerned about the harmful effects on minority populations. Would he have even have known this if the graph just had one composite line for blood lead?” Maybe not. Sometimes flukes of data presentation are all it takes to influence public policy.
This chart is probably one of the earliest known visual correlations of gasoline lead with lead poisoning in children. As an historical artifact it deserves a little place in history.
¹If you’re wondering why the chart doesn’t show white children, the answer is lost to history. Nussbaum thinks it might have something to do with the limits of plotting technology at the time. In any case, everyone knew what the line looked like: just like the other two, but lower.
²Ironically, they got the right answer for the wrong reason. EPA figured the summer spike was due to increased driving. In fact, we now know it’s due to lead that settles into the soil and then gets resuspended into the air every summer when the soil dries up.