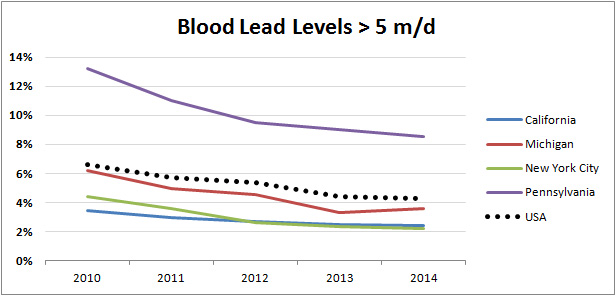
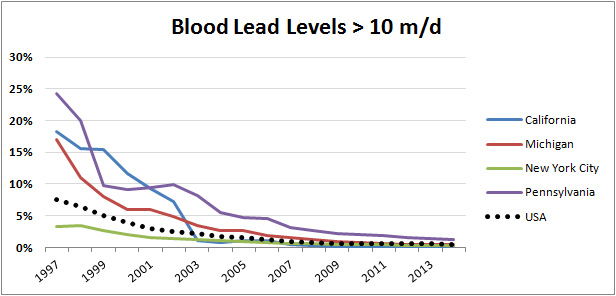
I don’t have any special point to make with these charts. They show blood lead levels in children over the past couple of decades for a few selected states, and they’re meant only to provide a bit of context for reporting about Flint. Complete data is here if you’re curious about how your state is doing.
For comparison, at the height of the water crisis Flint reported BLLs above 5 m/d for about 6 percent of its children. The latest round of testing suggests that Flint is now down to 3 percent.


