

So how are our kids doing? I mean, really doing? In particular, how are our black high-school kids doing at math?
A few days ago I showed the results for the Long-Term NAEP math test. This is a version of the NAEP that’s stayed fairly similar over the years so that it’s possible to see long-term trends. But Bob Somerby isn’t buying it. Why not look at the Main NAEP instead, since that’s the standard version of the NAEP that usually gets all the headlines?
There are two reasons. First, the Main NAEP starts in 1990, so if you want to see longer-term trends, it’s useless. More to the point, it’s not even that useful for medium-term trends because there was a major break in 2005: the test changed and the scale changed, from a 500-point scale to a 300-point scale. So what happened between 2000 and 2005? No one knows. There are no official comparisons.
Still, you can do this: look at the change from 1990-2000 and the change from 2005-2013. That should give you a reasonable idea of what’s happened over the past 25 years. When Somerby does this, he gets 6.11 + 5.24 = +11.34 points. 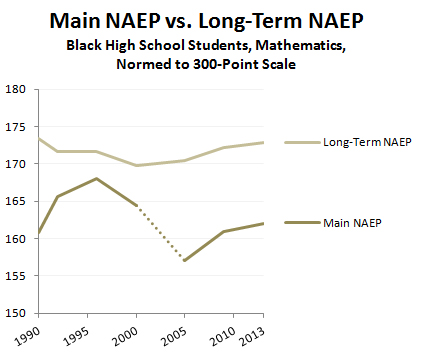 That’s a pretty good gain. By contrast, when you look at the Long-Term NAEP scores over that same period, you get a drop of -1 points. That’s a huge difference. What’s going on?
Let’s take a crack at figuring this out. The long-term scores are easy: neither the test nor the scale have changed, so you just look at the numbers and multiply all of them by 3/5 to norm them to a 300-point scale. For the main test, we need to norm the 1990-2000 scores to a 300-point scale and then paste them together with the 2005-2013 scores. The chart on the right shows what you get.
On the long-term test, scores are still down by about 1 point. Nothing much has changed. But on the main test, scores are up by only 1 point instead of 11 points. What happened? Two things:
- The 6-point increase from 1990-2000 becomes a 3.6-point increase when you renorm it to a 300-point scale.
- There’s an unrecorded drop of 7.4 points between 2000 and 2005.
Altogether, this shaves about 10 points from the raw 11-point gain. If that’s accurate, it means there’s no mystery. One test is up by a point and the other is down by a point. Since these tests have a margin of error of about one point, that’s close enough to identical not to worry about.
Needless to say, this leaves us with some questions. Is it acceptable to casually renorm scores by simple multiplication? Is the drop between 2000 and 2005 real? Or is it because the test got harder? Why do scores on the main test bounce around considerably while scores on the long-term test stay pretty stable? There hardly seems to be any correlation between scores on the two tests at all.
Almost certainly, experts would be aghast at all this renorming and extrapolation. But I think it gets us closer to the truth. And one way or another, you have to account for that 2000-05 gap. If you ignore it, you’re ignoring what could be a substantial part of the story.
In any case, this is why I think you’re better off looking at the long-term test if you want to see long-term trends. That’s what it’s designed for, and you don’t have to monkey with the data. Either way, though, we end up with pretty much the same story: black test scores (and white scores and Hispanic scores) have been pretty stagnant since 1990 for high school seniors. This doesn’t mean the gains in earlier grades are nothing to celebrate. They are, and reporters should pay more attention to them. In the end, though, it doesn’t matter what the score is in the sixth inning if your bullpen consistently blows big leads. What we care about is how well educated our kids are when they leave school and enter the world. Until our high schools are able to build on the big gains they’re inheriting from middle schools, we’re not going to see any improvement on that score.
POSTSCRIPT: If you want to look at the raw data yourself, there are plenty of ways to do it. However, the following printed reports provide easy access to all of it:
For what it’s worth, two more notes. First, the main test is given to 12th graders. The long-term test is given to 17-year-olds, who are both 11th and 12th graders. Also: since 2000, the two tests have been given a year apart. Neither of these is likely to affect scores or trends in any material way.