

Tyler Cowen passes along the following chart, a modified version of one Matt Yglesias used to show the trend of total government expenditures (federal + state + local) and declare “2014 is the year American austerity came to an end”:
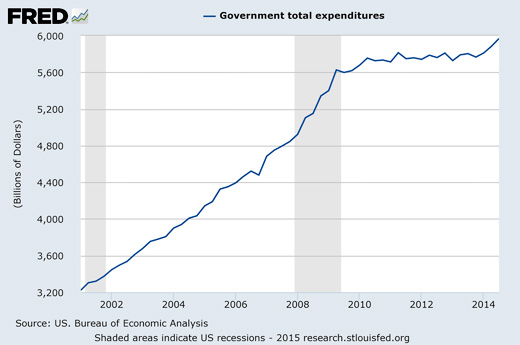
This comes from Angus, who comments incredulously: “From this graph I concluded one of two things must be true depending on one’s definition of austerity. Either austerity means nominal cuts and we never had any of it, or austerity means cuts relative to trend and we are still savagely in its grasp.”
Oh come on. There’s an obvious third option. Let’s take a look at this chart done right:
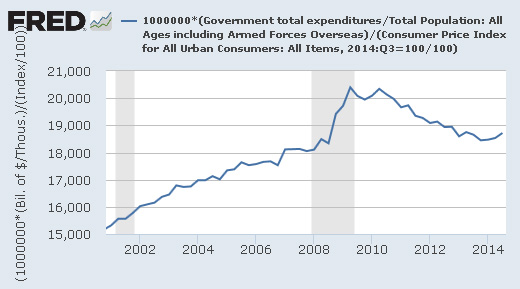
This is real per-capita government expenditures (using 2014 dollars). I used CPI, but it looks the same no matter which inflation measure you prefer (PCE, GDP deflator, % of GDP, whatever).
Austerity is all about the trajectory of government spending, and this is what it looks like. You can argue about whether flat spending represents austerity, but a sustained decline counts in anyone’s book. The story here is simple: for a little while, in 2009 and 2010, stimulus spending partially offset state and local cuts, but by the end of 2010 the stimulus had run its course. From then on, the drop in government expenditures was steady and significant. It was also unprecedented. If you run this chart back for 50 years you’ll never see anything like it. In all previous recessions and their aftermaths, government spending rose.
Finally, in 2014, the spending decline stopped. Austerity was over, and now we’re even starting to see a small uptick in government spending. At the same time, the economy started to pick up.
This is not bulletproof evidence that austerity is bad for the economy, or that government spending helps it. But it’s certainly consistent with the hypothesis, and it’s really not hard to see.