

I finally got around to reading last week’s New York Times story about the widening education gap between high and low-income students. The chart on the right tells the story: according to research by Sean Reardon, the gap in reading performance between  black and white children has declined by about one grade level since 19701 (one “unit” on the chart is three grade levels). At the same time, the gap between rich and poor has gone up by nearly two grade levels:
“With income declines more severe in the lower brackets, there’s a good chance the recession may have widened the gap,” Professor Reardon said….One reason for the growing gap in achievement, researchers say, could be that wealthy parents invest more time and money than ever before in their children (in weekend sports, ballet, music lessons, math tutors, and in overall involvement in their children’s schools), while lower-income families, which are now more likely than ever to be headed by a single parent, are increasingly stretched for time and resources. This has been particularly true as more parents try to position their children for college, which has become ever more essential for success in today’s economy.
This all seems pretty believable, but it’s a little odd nonetheless. Here’s another chart, this time from the long-term NAEP test, showing reading performance among 9-year-olds at the top and bottom of the performance spectrum:
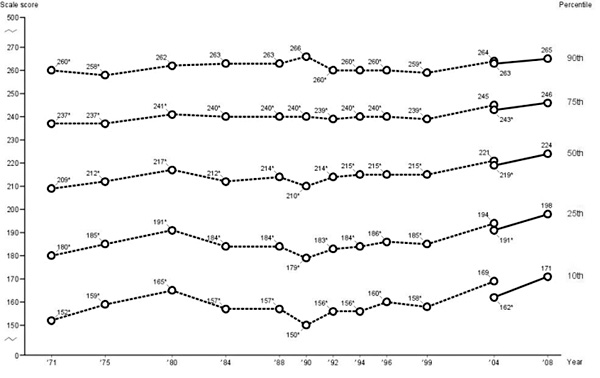
These two charts aren’t necessarily contradictory. One shows income levels and the other shows performance levels. Still, common sense suggests that the top percentiles of performance are mostly made up of high-income kids while the lowest percentiles are mostly made up of low-income kids. And on the performance chart, the gap hasn’t been growing at all. In 1971, the gap between the top 10% and the bottom 10% was 108 points (on a scale where ten points is roughly one grade level). In 2008 the gap was down to 94 points. The gap shrunk by about one and a half grade levels during the exact same period that Reardon says the income gap increased by about one and a half grade levels. If you compare the top 25% to the bottom 25% you see about the same thing.
So….I dunno. As I said, these are two different measurements, and the NAEP test doesn’t break down scores by income. But it still seems surprising that there’s such a difference. At the very least, I wish the Times had explored this and tried to explain it.
1Note that the Reardon chart is by birth year. So look at the numbers in 1960 to see the gap between 9-year-olds in 1970.