: NOAA National Climatic Data Center")
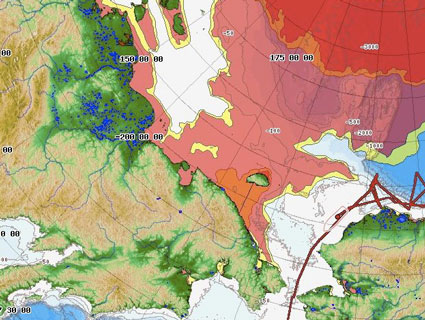
Precipitation associated with Sandy, 23-31 Oct 2012 (preliminary): NOAA National Climatic Data Center
According to NOAA’s National Climatic Data Center State of the Climate Report, post-tropical cyclone Sandy made landfall with a central minimum pressure of 946 millibars—potentially a record low for the Northeast coast, pending further assessment. The storm also rated as the largest hurricane to form in the North Atlantic in terms of wind spread, with a gale diameter of 945 miles.
This month’s report focuses on Sandy as the monster rampaging through October. Here are a few other noteworthy stats associated with that storm:
- The observed water level at The Battery in New York City of 13.8 feet set an all-time record there, topping Hurricane Donna’s 1960 record by more than three feet.
- The Delaware River in Philadelphia set a new record high water level of 10.6 feet, beating out the previous high of 10.5 feet set in April 2011.
- Sandy’s blizzard dropped more than a foot of snow in six states from North Carolina to Pennsylvania, shattering October monthly and single storm snowfall records. Snowfall totals in the highest elevations approached three feet.

NOAA National Climatic Data Center
Aside from Sandy’s mayhem, October was shaping up to be a relatively benign month by 21st century standards. The average temperature in the lower 48 was 53.9°F—0.3°F below the long-term average. That ended a 16-month streak of above-average temperatures starting in June 2011.
But even October couldn’t mitigate the bigger picture for the year. The period between January and October 2012 saw the warmest first ten months of any year on record for the contiguous US dating back to 1895.
- The national temperature of 58.4°F was 3.4°F above the 20th-century average and 1.1°F above the previous record warm between January and October 2000.
- The first 10 months of 2012 racked up as record warm in 21 states.
- The first 10 months of 2012 racked up among the 10 warmest in 25 states.
- Only Washington state saw temperatures near average for the period.

NOAA National Climatic Data Center
As you can see from this graph, previous record hot years dating back to 1895 were wiped out by 2012’s heat so far (click graph for larger image). That heat led to a few other costly complications in terms of drought and crop failures:
- January-October 2012 was the 16th driest period on record for the lower 48: precip totals 1.9 inches below the average of 24.78 inches.
- Drier-than-average conditions were present from the Southwest, through the Rockies, across the Plains and into the Midwest.
- Nebraska and Wyoming were record dry for the period. Nebraska’s statewide precipitation total of 11.92 inches was 9.4 inches below average, while Wyoming’s precipitation of 6.57 inches was 5.2 inches below average.
- The Gulf Coast, parts of the Northeast, and the Pacific Northwest were wetter than average during January-October.
- Washington’s year-to-date precipitation total was 33.23 inches, 7.36 inches above average, and the fourth wettest January-October on record.
From the report:
The U.S. Climate Extremes Index (USCEI), an index that tracks the highest and lowest 10 percent of extremes in temperature, precipitation, drought and tropical cyclones across the contiguous U.S., was nearly twice the average value during the January-October period, and marked the second highest USCEI value for the period. Extremes in warm daytime temperatures, warm nighttime temperatures, and the spatial extent of drought conditions contributed to the record high USCEI value.