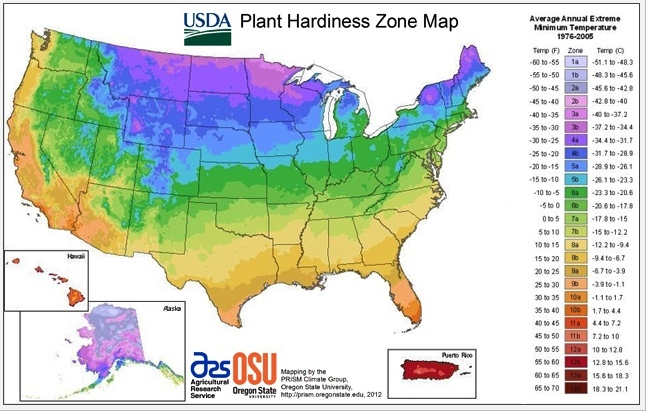

2012 plant hardiness zone map. Click for interactive image: USDA and Oregon State University
The US Department of Agriculture (USDA) released a long overdue new version of their Plant Hardiness Zone Map yesterday—the first update since 1990.
How out of date was the 1990 map? It was based on data from 1974 to 1986. That’s 26 years ago.
The new map is interactive, which is cool, and based on a much finer data scale than the old one, which is great. And guess what. It shows that things are getting warmer. The USDA managed to pretty much bury that fact in Bureaucratese in their press release (highlights are mine):
Compared to the 1990 version, zone boundaries in this edition of the map have shifted in many areas. The new map is generally one 5-degree Fahrenheit half-zone warmer than the previous map throughout much of the United States. This is mostly a result of using temperature data from a longer and more recent time period; the new map uses data measured at weather stations during the 30-year period 1976-2005. In contrast, the 1990 map was based on temperature data from only a 13-year period of 1974-1986.
 1990 USDA plant hardiness: USDA
In the 1990 map above you can see the scale is less fine. But you can also tell at a glance where things have changed in a big way, compared to the 2012 map… in the southern Rockies, southern Appalachians, upper Michigan, swathes of the Canadian and Mexican borders, coastal California, etc.
The 2012 map comes with its own interesting climate-phobic history, as noted by Cornell University’s gardening.cornell.edu:
In 2003 the American Horticultural Society released a draft version of a new map based on data from 1986 to 2002, which showed dramatic northward movement of hardiness zones. USDA pulled this map from circulation and had said they would release an updated map in 2005. Instead, in 2006 the Arbor Day Foundation issued a map noting that indeed climate zones had shifted significantly from 1990 to 2006, implying that the climate was warming. The map released today by USDA confirms many of these trends.
 2006 Arbor Day plant hardiness map: Arbor Day Foundation
Here’s the 2006 Arbor Day Foundation map, using the same scale as the 1990 map. You can see how things have warmed and how the planting zones are shifting north. If you parse this map against the finer-scale of the 2012 map, they look pretty much the same.