This story first appeared on the Atlantic Cities website and is reproduced here as part of the Climate Desk collaboration.
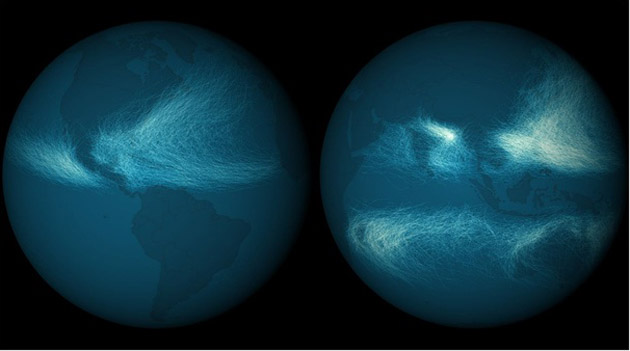
Should you pilot a small, rickety craft across international waters this summer, it would be wise to consult this unusual map of foul ocean weather. The gusty cartography plots the paths all the tropical cyclones recorded in the past 170 years. Brighter areas show where they have overlapped in space, representing areas of historically frequent hurricane activity—tumultuous ocean zones probably best to steer around.
Visualization super-nerds at NOAA (that’s meant in the most flattering way) conjured this top-down look at hurricanes and Pacific cyclones using storm-track records from the National Climatic Data Center. The records date back to 1842 and include both satellite data and first-person accounts from (no doubt really stressed) mariners. Though the U.S. government stocks such information on 11,967 tropical cyclones, that number is probably smaller than what has actually blown across the seas over the ages. Satellites nowadays keep a laser bead on these powerful storms, but back when sailors were responsible for snitching on them, one could flail about in the middle of the ocean without many people noticing.
This key shows where on the map the highest points of overlap are:

NOAA has a few things to note about why history’s tempests tend to repeat themselves:
By coloring how many times any storm track overlapped another, certain patterns arise in the density of storms affecting a given area. Cyclone tracks overlapped the most in the western Pacific and Bay of Bengal (India), where typhoon season never ends since waters are always warm enough to sustain cyclone formation. The frequency of track overlaps is much lower in the Western Hemisphere than in the Eastern Hemisphere, however, a related map showing storm intensity seen here shows an interesting contrast.
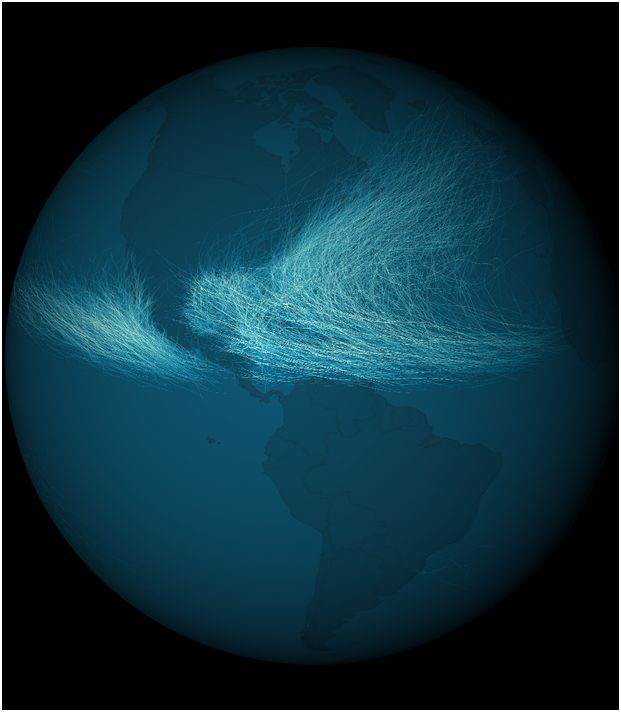
Here’s that related map of cyclone strength, broken down into eastern and western hemispheres. Again, areas of brighter hues represent higher values (in this case, wind speeds). First the Americas:
And now Asia, Africa, and Australia:
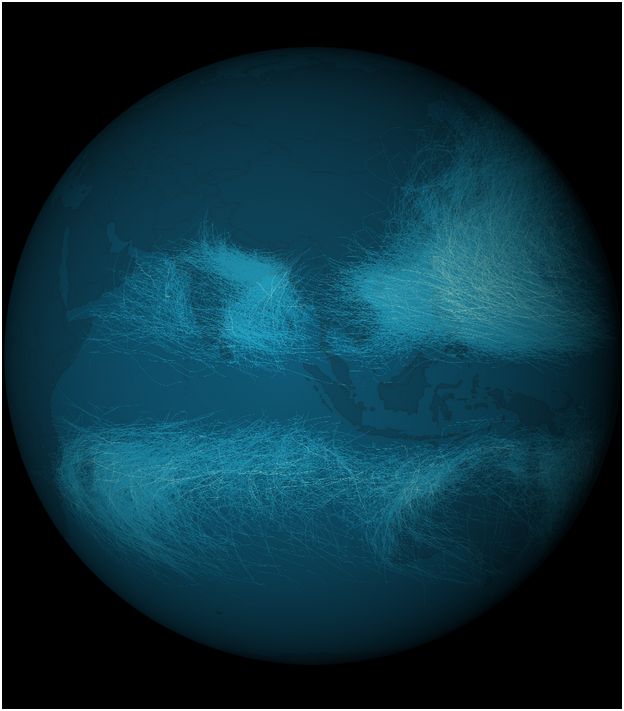
One takeaway: People living on the western coast of Central America and on the sprawling eastern and southern contours of North America, including around the Gulf of Mexico, have a good chance in their lifetimes of encountering extra-ferocious hurricanes. The range of intense cyclones on the other side of the globe is more limited. As NOAA notes, there the “strongest cyclones seem to group near the Philippines.”