

I don’t have any deep comments to make on this, but I wanted to share a couple of charts from the Fed’s latest report on household debt. First up, here’s a chart showing the number of loans that are severely delinquent:
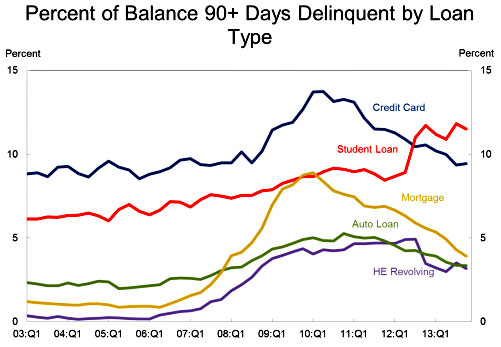
One of these lines is not like the others. In general, delinquencies rose throughout the recession, and then began dropping as the economy began to improve around 2010-11. But not student loans. Delinquencies on student loans have been rising steadily for a decade, and when the economy began its recovery, they just went right on rising. Welcome to life as a college graduate.
The next chart shows the number and size of loans that have been turned over to third-party collectors:
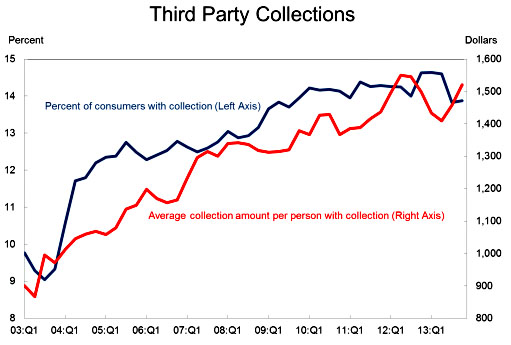
The number of consumers who are being hounded by collectors rose during the recession, and then kept on rising. It’s flattened out in the past couple of years, but it hasn’t started decreasing yet. Ditto for the average collection, which has just gone up and up and up.
Multiply the two together and here’s what you get. In 2003, the per capita amount of debt under collection was about $110 adjusted for inflation. In 2013 it was about $210. In ten years, this number has nearly doubled. Welcome to life outside the upper middle class.